How to Read Fishing Charts for Better Catches

TL;DR:
- Most anglers spend more time guessing at water features than actively fishing, which reduces success. Learning to read fishing charts reveals underwater structure, depth changes, and predator habitats, transforming their effectiveness. Applying the “Three Cs” framework—constrictions, confluences, and corners—enhances structural targeting, especially when layered with weather and tidal data for peak feeding periods.
Most anglers spend more time guessing than fishing. You know the feeling: you pick a spot based on a hunch, drop your line, and wait. Nothing. Learning how to read fishing charts changes that dynamic completely. Charts reveal what’s happening beneath the surface — depth changes, underwater structures, current channels, and the exact spots where predator fish set up to feed. This article walks you through fishing chart basics, the “Three Cs” framework for finding fish-holding structures, how to layer in weather data, and a practical planning process you can use before every trip.
Table of Contents
- Key takeaways
- How to read fishing charts: types, symbols, and structure
- The “Three Cs” framework for locating fish
- Using weather data alongside your chart
- Planning a fishing trip step by step
- Troubleshooting common chart-reading mistakes
- My take on reading charts and why most anglers sell themselves short
- Put your chart skills to work on the water
- FAQ
Key takeaways
| Point | Details |
|---|---|
| Chart types matter | Know the difference between nautical, bathymetric, and electronic charts to pick the right tool for your water. |
| Contour lines reveal structure | Tightly spaced lines mean steep drops; wide spacing means gradual slopes. Both affect where fish hold. |
| The “Three Cs” find fish | Constrictions, confluences, and corners are the three structural patterns that consistently hold fish on any chart. |
| Weather data multiplies results | Barometric pressure, tides, and solunar periods combined tell you not just where to fish, but when. |
| Always verify on the water | Charts are starting points. Sonar, water color, and real-time observation confirm or redirect your plan. |
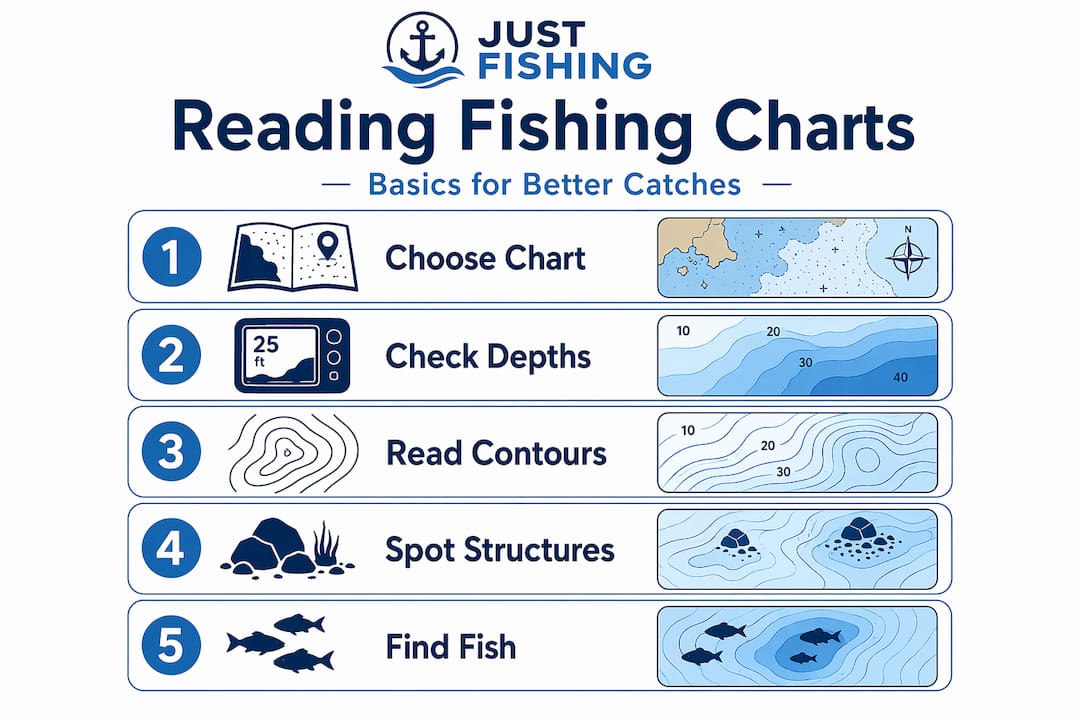
How to read fishing charts: types, symbols, and structure
Before you can interpret anything, you need to know what kind of chart you’re looking at. There are three main types used by recreational anglers: nautical charts, bathymetric maps, and electronic fishing charts.
Nautical charts are the traditional tool, originally designed for marine navigation. They show water depth through numbered soundings (the small numbers scattered across the water areas), hazards, buoys, and shoreline features. Bathymetric maps focus almost entirely on underwater topography, using contour lines to illustrate the shape of the lake or sea floor. Electronic fishing charts, built into modern fishfinders and chart plotters, combine both approaches with added layers.
Understanding contour lines is where fishing chart basics really begin. Each line connects points of equal depth. Contour lines close together indicate a steep depth change, while lines spread far apart show a gradual slope. A quick glance at contour spacing tells you whether you’re looking at a sharp underwater cliff or a slow-tapering flat.
Common chart symbols and depth numbers
Depth soundings on nautical charts are shown in feet or meters depending on the chart’s datum. Always check the legend first. A number like “35” sitting alone in the water area means 35 feet of depth at that recorded point. Look for clusters of soundings to understand how depth changes across a zone, not just at a single spot.
Electronic charts add a layer of power that paper maps can’t match. Modern electronic charts include features like enhanced bathymetry, Relief Shading, and Fishing Chart overlays that highlight creek beds, submerged flats, and drop-offs invisible on standard views. Switching between these layers on your plotter takes seconds and can completely reframe where you decide to fish.
Here’s a quick reference for symbols you’ll regularly encounter:
- Depth soundings: Isolated numbers showing measured depth at that coordinate
- Contour lines: Curved lines connecting equal-depth points across the bottom
- Hatch marks or stippling: Indicates shallow areas, reefs, or rocky substrate
- Anchor symbols: Suggest suitable anchorage, often near structure
- Current arrows: Show direction of tidal or river flow
Chart scale is also worth paying attention to. A 1:10,000 scale chart gives you far more detail per area than a 1:100,000 chart. For finding specific fish-holding structures, the larger-scale (more detailed) chart wins every time.
The “Three Cs” framework for locating fish
Lake contour maps consistently reveal three structural patterns that hold fish: constrictions, confluences, and corners. Once you know what these look like on a chart, you’ll stop scanning randomly and start marking high-probability zones within minutes of opening a map.
Here’s how to identify each one:
Constrictions: These are narrow points where water funnels between two wider areas. On a chart, look for an hourglass shape where the contour lines pinch inward. The classic example is a saddle between two underwater humps. A saddle between two humps funnels baitfish through a tight corridor, and predators know it. Most anglers see the humps and fish them directly. The saddle between them is almost always more productive.
Confluences: These are points where two bodies of water meet — a creek channel entering a main lake basin, a tributary flowing into a river, or two current systems intersecting in open water. On a chart, a confluence shows up where a secondary contour channel converges with a larger feature. Current pushes baitfish into these mixing zones, and game fish position themselves at the edge to intercept.
Corners: Anywhere the bottom or shoreline makes a directional change. An inside turn in a channel, a point extending from the bank, a bend in a river. These create current eddies and depth transitions that break up the water column and concentrate fish. Inside corners are especially productive in rivers because current drops its sediment load there, building up food sources over time.
| Structure type | What it looks like on a chart | Why fish hold there |
|---|---|---|
| Constriction/Saddle | Hourglass shape between two bullseye humps | Funnels baitfish, forcing them into a tight zone |
| Confluence | Two contour channels merging | Mixes currents, concentrates suspended bait |
| Corner/Point | Contour lines bending sharply outward or inward | Creates current breaks and depth transitions |
Seasonal behavior shifts how you weight each structure. In spring, fish moving shallow favor corners and points near spawning flats. In summer, deep constrictions between humps hold suspended fish. In fall, confluences near creek mouths become feeding highways as baitfish follow cooling water.
Pro Tip: When scanning a new lake chart, circle every saddle between pairs of humps first. These spots are overlooked by most anglers and consistently produce fish across multiple species.
Using weather data alongside your chart
Knowing where fish should be is only half the equation. Knowing when they’ll feed turns a decent trip into a great one. This is where learning how to read fishing weather data alongside your charts pays off.
Barometric pressure is the single most overlooked variable in recreational fishing. Barometric readings above 30.2 inHg generally produce sluggish fish that are harder to provoke. Readings below 29.8 inHg, especially when falling rapidly, trigger aggressive feeding behavior as fish sense an incoming storm. The best feeding window is often the few hours before a cold front arrives, not during stable conditions.

Tide charts matter enormously in saltwater and tidal river fishing. Moving water activates fish. The strongest feeding periods typically occur on the incoming tide when baitfish get pushed onto flats and into structure, and the first two hours of an outgoing tide when fish chase prey flushing out of shallower areas.
Solunar periods add another layer. Fishing forecasts that combine solunar periods, moon phase, tides, and barometric pressure are better predictors of peak feeding times than any single variable alone. Several apps now generate a daily fishing score rating conditions from poor to outstanding, which you can cross-reference with your chart’s structural findings.
Here’s how to stack these data points:
- Check the barometric trend for 24 hours before your trip, not just the current reading
- Identify the two strongest tidal movements (incoming and outgoing) for your fishing window
- Note the major and minor solunar periods for the day
- Look for overlap. A falling barometer + incoming tide + major solunar period within the same two-hour window is as good as it gets
The best chart apps for integrating all of this include options that overlay weather layers directly onto your fishing map. For anglers using marine electronics, many chart plotters now allow tidal data and weather overlays in the same display as your bathymetric chart.
Planning a fishing trip step by step
Charts are only useful if you have a process for translating them into a plan. Here’s a repeatable workflow that takes 20 to 30 minutes before any trip:
Open your chart and identify water type. Fresh or salt, river or lake, open offshore or inshore. This sets which features you’re prioritizing.
Locate structural features using the Three Cs. Mark constrictions, confluences, and corners. Aim for 3 to 5 candidate spots, not one.
Cross-reference depth. Check whether your target species prefers the depth range at each marked spot for the current season. A perfect saddle at 60 feet means nothing if you’re targeting bass that are holding in 15 feet of water in May.
Layer in environmental data. Check the tide, barometric trend, and solunar periods. Rank your candidate spots by which ones align best with expected feeding windows.
Arrive and verify. Fishing map data combined with on-site observation of water color, baitfish activity, and sonar readings gives you the clearest picture. Charts tell you where the structure is. Your eyes and sonar confirm whether fish are actually using it.
Stay flexible. If spot one produces nothing after 20 minutes, move to spot two. Preparing 2 to 4 candidate spots before the trip and rotating through them is more productive than grinding one location based on a chart reading alone.
Troubleshooting common chart-reading mistakes
Even experienced anglers make these errors when learning to interpret fishing charts. Recognizing them saves you hours of unproductive water time.
- Misreading contour spacing: Assuming all contour intervals are the same. Always check the legend for the interval value. A map with a 5-foot interval looks completely different from one using 10-foot intervals, even on the same lake.
- Fixating on one spot: Charts can make a single location look irresistible. But fixating on one spot at the expense of flexibility is one of the most common reasons anglers blank. Mark multiple options every time.
- Ignoring current changes: A structure that holds fish on an incoming tide may be dead on an outgoing tide. Charts don’t change, but the fish do.
- Skipping sonar verification: Charts are snapshots, often based on data that’s years old. Submerged timber, seasonal vegetation, and bottom composition can change. Your fish finder tells you the current truth.
Pro Tip: If you’re using an electronic chart app, turn on the Relief Shading layer the first time you open any new body of water. The 3D depth shading often reveals saddles and drop-offs that the standard chart view completely hides.
My take on reading charts and why most anglers sell themselves short
I’ve seen anglers buy the best rods, spend more on lures than I’d care to admit, and still come home empty-handed. Most of them had zero idea how to analyze fishing maps before heading out. They treated charts as an afterthought, not a tool.
Learning the Three Cs changed how I fish. Not because it’s some hidden secret, but because it gave me a framework for making decisions instead of just guessing. When I started mapping saddles before every lake session, my catch rate on a completely unfamiliar body of water went up significantly within a few trips. The chart wasn’t doing the fishing. It was eliminating 80% of the water where fish weren’t.
The common myth I keep hearing is that only offshore tournament anglers need to study charts. That’s backwards. Charts matter most for the recreational angler who only gets out two or three times a month. You don’t have the time to learn a body of water through trial and error. A half hour with a good bathymetric map and some weather data gives you what would otherwise take an entire season to figure out.
My practical recommendation: start with one lake you know well. Pull up the best available bathymetric chart and find every saddle between humps. Fish those specifically for two trips. You’ll quickly understand what the chart is showing you in a way no article can fully replicate.
— Alaa
Put your chart skills to work on the water
Reading charts is one thing. Getting out on the water and applying them is where the real learning happens.
Justfishinggroup has the gear and the trips to take your chart skills from theory to practice. Whether you’re targeting structure-holding species with a precision minnow lure or looking for a guided trip to apply your map-reading skills alongside experienced captains, Justfishinggroup covers both sides. Browse the full catalog of rods, lines, jigs, and terminal tackle at justfishinggroup.com, or explore guided fishing trips across the Maldives, UAE, Seychelles, and beyond. There’s no better way to sharpen your chart-reading instincts than fishing unfamiliar water with an expert who already knows every structure on the chart.
FAQ
What are contour lines on a fishing chart?
Contour lines connect points of equal depth across the water body’s floor. Closely spaced lines indicate steep drop-offs, while widely spaced lines indicate gradual slopes.
How do I find fish using a depth chart?
Focus on the Three Cs: constrictions (funnels or saddles between humps), confluences (where channels or currents meet), and corners (points and inside turns). These structural features consistently hold fish across species.
What is the best fishing chart app?
Several chart apps allow you to overlay bathymetric data with real-time weather, tides, and solunar periods. Electronic chart plotters from brands like Garmin also offer multi-layer fishing chart views that highlight structures standard maps miss.
How does barometric pressure affect fishing?
Rapidly falling pressure, particularly readings dropping below 29.8 inHg, triggers aggressive feeding in fish ahead of incoming storms. Stable or rising high pressure above 30.2 inHg typically slows fish activity.
Do I still need to use sonar if I have a fishing chart?
Yes. Charts provide structural data, but sonar confirms whether fish are actually present at a location on a given day. Combining chart data with live sonar readings is the most reliable way to find and catch fish consistently.